Tutorials
Note: tutorials are currently still under development, and more will be added in the upcoming year. All tutorials are in the R programming language, save for one PostGIS tutorial.
R Spatial Workshop Notes
Workshop notes and scripts from the R Spatial Workshop can be found at the following link. Topics to be covered include spatial data manipulation, mapping, and interactive visualization.
Please see our Events page for more information about these workshops.
Introduction to Spatial Data Science
Below are the R lab notes from Luc Anselin’s Introduction to Spatial Data Science course at the University of Chicago taught in Fall 2018. These labs mirror the GeoDa notebooks, but use R rather than GeoDa. Thank you Grant Morrison for his work on these R tutorials.
- Spatial Data Handling: Import, manipulate, and map abandoned vehicle data to make a choropleth map of abandoned vehicles per capita for Chicago community areas.
- Exploratory Data Analysis 1 - Univariate and Bivariate Analysis: Explore NYC socioeconomic data by borough and perform exploratory spatial analysis involving univariate plots, smoothing methods, and linear fits.
- Exploratory Data Analysis 2 - Multivariate Exploration: Continue to explore NYC socioeconomic data using spatial data analysis methods for three or more variables, including scatter plots, bubble plots, and parallel coordinate plots.
- Basic Mapping: Finish working with NYC socioeconomic data by creating and customizing a variety of maps, including choropleth maps, conditional maps, and cartograms.
Spatial Weights Tutorials - new!
- Rate Mapping: Create rate maps using Cleveland house price data.
- Contiguity Spatial Weights: Construct and interpret contiguity-based spatial weights with US county-level homicide data.
- Distance-Based Spatial Weights: Construct and interpret distance-based spatial weights with Cleveland home sales data.
- Spatial Weights as Distance Functions: Compute inverse distance and kernel weights functions with Cleveland home sales data.
- Applications of Spatial Weights: Create spatially lagged variables and rates, perform spatial smoothing with Cleveland home sales data.

Cluster Analysis in R
The following tutorials were prepared by Luc Anselin in 2017 for his Introduction to Spatial Data class.
- Dimension Reduction Methods: Learn about Principal Components Analysis (PCA) and multidimensional scaling using the Guerry dataset and the
foreignandggplot2R packages. - Classic Clustering Methods: Use hierarchical clustering and k-means clustering on the same dataset with the
hclustandkmeansfunctions in base R. - Spatially Constrained Clustering Mehods: Carry out contiguity-constrained clustering with SKATER algorithm and the
rgdal,spdep, andmaptoolspackages.
Basic R Tutorials
The following are notes that Luc Anselin has put together to introduce R to his undergraduate classes. They provide an overview of data manipulation and visualization methods, using geographic data as an example.
- Manipulating Data Frames: Read, write, summarize, and wrangle data with the
foreignR package (for dbf files) and thetidyverse. - Data Visualization (1): Visualize data using the
ggplot2package, creating scatterplots and fitting lines to NYC sub-borough data. - Data Visualization (2): Extend the visualizations of the previous tutorial, using
ggplot2to customize scatterplots, create histograms, boxplots, and more. Learn about reshaping data into a tidy format usingtidyr. - Basic Mapping: Manipulate and map spatial data, creating custom choropleth maps with NYC borough data, using the
sf,tmap, andRColorBrewerpackages.
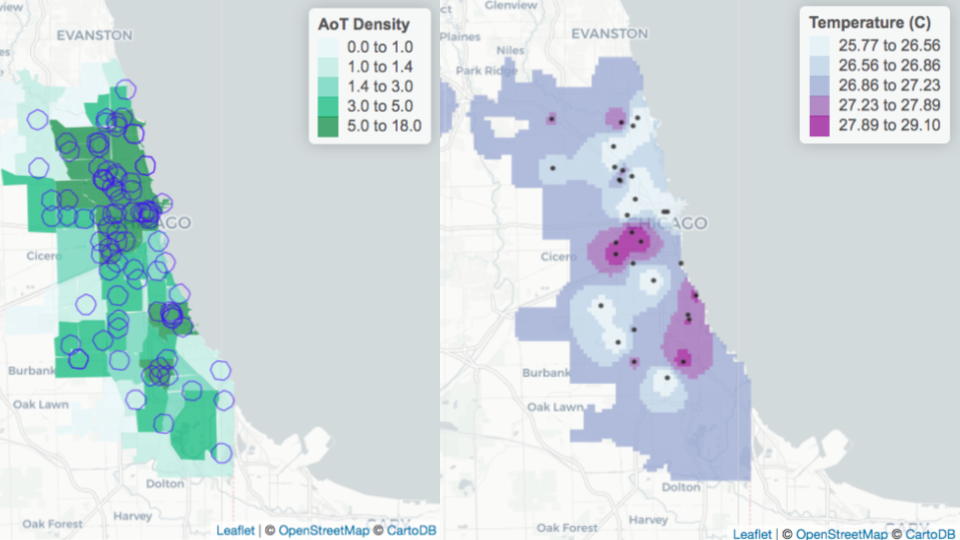
Mapping Array of Things Data With Spatial Statistics
This two-part spatial statistics tutorial was put together by Anais Ladoy, Isaac Kamber, Marynia Kolak, Julia Koschinsky, and Luc Anselin, and focuses on using Array of Things sensor data to create map visualizations and perform spatial analysis. It has been taught at Argonne National Laboratory in August 2018 and at the Chicago Department of Public Health in April 2019.
Download data for this workshop at this Github link.
- Part 1: Sensor Data Access and Mapping Basics: Learn to read and inspect data, convert data to spatial formats, map nodes with community areas, and develop a density map of sensors using buffers and re-projected data.
- Part 2: Interpolating Temperature Data: Interpolate temperature readings to develop a kriging surface. Learn some filtering and aggregation techniques for data wrangling practice, and then prepare for two models of kriging (spherical and exponential).
PostGIS Tutorial
Learn how to create spatial queries and perform spatial analysis in PostGIS databases using this tutorial developed by Clayton Hunter and Julia Koschinsky.
Opioid Environment Toolkit
Introduction to Spatial Analysis for Opioid Environments in R
This toolkit provides an introduction to GIS and spatial analysis for opioid environment applications, allowing researchers, analysts, and practitioners to support their communities with better data analytics and visualization services. It introduces basic spatial analytic functionalities in R (tmap, sf, tidygeocoder, tidycensus, tigris) using applied examples for visualizing, mapping, and understanding the opioid risk environment. It covers the following topics:
- Geocoding Resource Locations
- Linking Community Data
- Census Data Wrangling
- Thematic Mapping
- Nearest Resource Analysis
The Opioid Environment Toolkit was developed by the Healthy Regions & Policies Lab as part of the Justice Community Opioid Innovation Network (JCOIN) of the NIH HEAL Initiative.