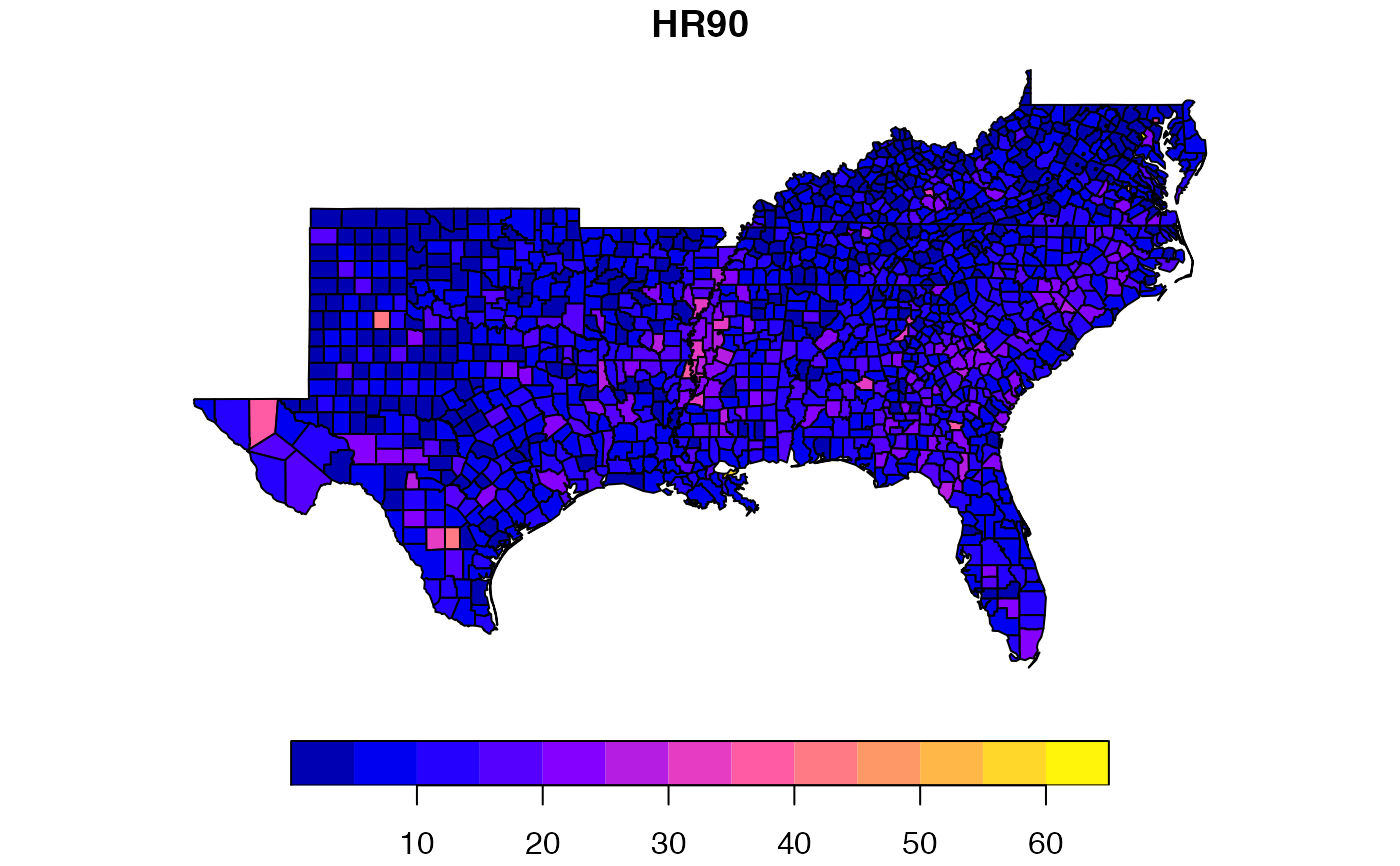
Homicides and selected socio-economic characteristics for Southern U.S. counties (subset of NCOVR national data set). Data for four decennial census years: 1960, 1970, 1980, 1990.
southom
Format
An sf data frame with 1412 rows, 70 variables, and a geometry column:
- NAME
County name
- STATE_NAME
State name
- STATE_FIPS
State fips code (character)
- CNTY_FIPS
County fips code (character)
- FIPS
Combined state and county FIPS code (character)
- STFIPS
State fips code (numeric)
- COFIPS
County fips code (numeric)
- FIPSNO
FIPS code as numeric variable
- SOUTH
Dummy variable for Southern counties (South = 1)
- HR**
Homicide rate per 100,000 population (1960, 1970, 1980, and 1990)
- HC**
Homicide count, three year average centered on 1960, 1970, 1980, and 1990
- PO**
County population in 1960, 1970, 1980, and 1990
- RD**
Resource deprivation in 1960, 1970, 1980, and 1990 (principal component)
- PS**
Population structure in 1960, 1970, 1980, and 1990 (principal component)
- UE**
Unemployment rate in 1960, 1970, 1980, and 1990
- DV**
Divorce rate in 1960, 1970, 1980, and 1990 (percentage= of males over 14 divorced)
- MA**
Median age in 1960, 1970, 1980, and 1990
- POL**
Log of population in 1960, 1970, 1980, and 1990
- DNL**
Log of population density in 1960, 1970, 1980, and 1990
- MFIL**
Log of median family income in 1960, 1970, 1980, and 1990
- FP**
Percentage of families below poverty in 1960, 1970, 1980, and 1990
- BLK**
Percentage of black in 1960, 1970, 1980, and 1990
- GI**
Gini index of family income inequality in 1960, 1970, 1980, and 1990
- FH**
Percentage of female headed households in 1960, 1970, 1980, and 1990
Source
S. Messner, L. Anselin, D. Hawkins, G. Deane, S. Tolnay, R. Baller (2000). An Atlas of the Spatial Patterning of County-Level Homicide, 1960-1990. Pittsburgh, PA, National Consortium on Violence Research (NCOVR) (www.ncovr.heinz.cmu.edu).
Details
Sf object, unprojected. EPSG 4326: WGS84.
