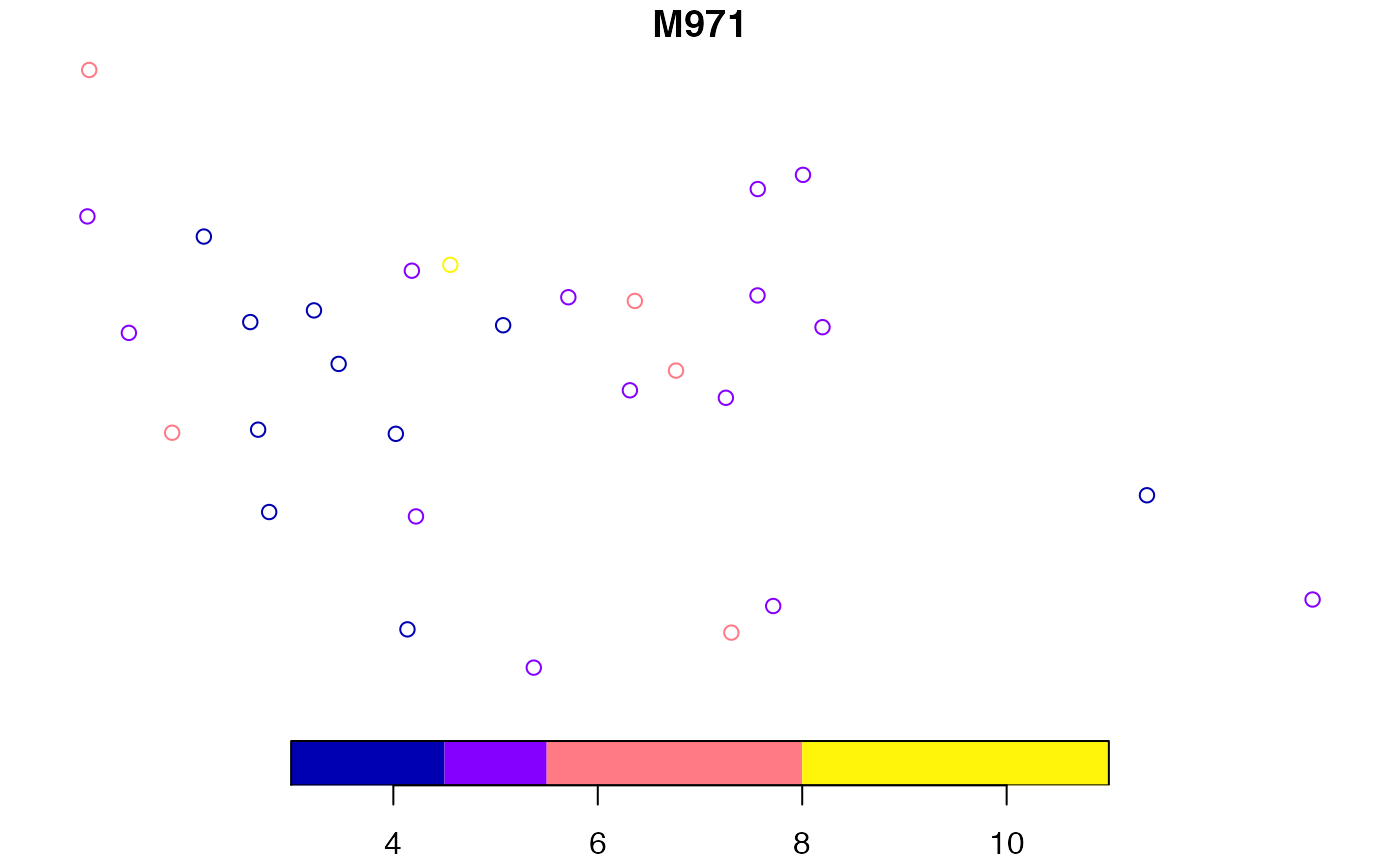
Monthly ozone measurements for 30 monitoring US stations (1997-1999).
ozone9799
Format
An sf data frame with 30 rows, 78 variables, and a geometry column:
- STATION
Station ID
- MONITOR
The monitor to which the data applies
- LATITUDE
Latitude of monitoring site (UTM Zone 11)
- LONGITUDE
Longitude of monitoring site (UTM Zone 11)
- X_COORD
X Coordinates
- Y_COORD
Y Coordinates (3 years (1997-99) x 12 months x 2 (max & average))
- Mxxy
Daily maximum for year xx and month y
- Axxy
Average or highest 8 hour period for year xx and month y
Source
Original data provided by James Murdoch, School of Social Sciences, University of Texas at Dallas, Richardson, TX 75083 (murdoch@utdallas.edu).
Details
Sf object, unprojected. EPSG 4326: WGS84.
Examples
#> Warning: bounding box has potentially an invalid value range for longlat data#> Warning: bounding box has potentially an invalid value range for longlat data