Demographic and housing data for New York City’s 55 sub-boroughs (2000s).
nyc_sf
Format
An sf data frame with 55 rows, 32 variables, and a geometry column:
- code
NYC Sub-Borough Neighborhood unique ID
- subborough
NYC Sub-Borough Neighborhood name
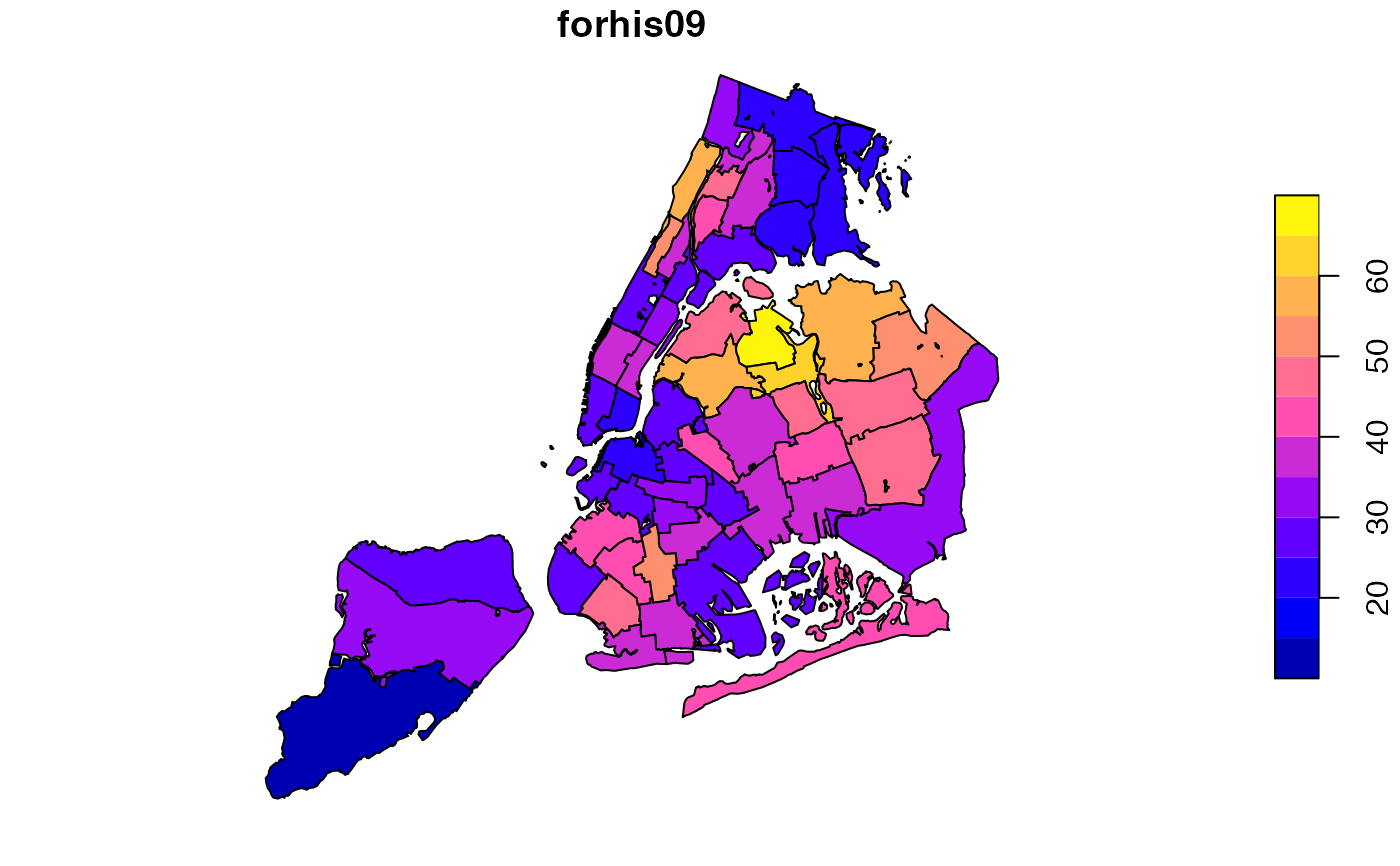
- forhis06-09
Percentage of hispanic population, not born in US
- forwh06-09
Percentage of white population, not born in US
- hhsiz1990
Average number of people per household
- hhsiz00
Average number of people per household
- hhsiz02-05-08
Average number of people per household
- kids2000, kids2005-2009
Percentage households w kids under 18
- rent2002,2005,2008
Median monthly contract rent
- rentpct02,05,08
Percentage of housing stock that is market rate rental units
- pubast90,00
Percentage of households receiving public assistance
- yrhom02,05,08
Average number of years living in current residence
- geometry
MULTIPOLYGON
Source
https://geodacenter.github.io/data-and-lab/nyc/
Details
Sf object, units in ft. EPSG 2263: NAD83 / New York Long Island (ftUS).