Employment and demographic information for the Lansing-East Lansing Metropolitan Statistical Area, Michigan (2000 Census data)
milwaukee1
Format
An sf data frame with 417 rows, 31 variables, and a geometry column:
- FIPS
FIPS Code
- MSA
MSA Name
- TOT_POP
Total population: Total
- POP_16
Total population: Under 16
- POP_65
Total population: 65+
- WHITE
Total population: Not Hispanic or Latino; White alone
- BLACK
Total population: Not Hispanic or Latino; Black or African American alone
- ASIAN
Total population: Not Hispanic or Latino; Asian alone
- HISP
Total population: Hispanic or Latino
- MULTI_RA
Total population: Hispanic or Latino
- MALES
Total population: Male
- FEMALES
Total population: Female
- MALE1664
Total population: Male working age 16-64
- FEM1664
Total population: Female working age 16-64
- EMPL16
Workers 16 years and over: Total
- EMP_AWAY
Workers 16 years and over: Did not work at home
- EMP_HOME
Workers 16 years and over: Worked at home
- EMP_29
Workers 16 years and over: Did not work at home; Travel time to work; Less than 30 minutes
- EMP_30
Workers 16 years and over: Did not work at home; Travel time to work; 30 minutes or more
- EMP16_2
Employed civilian population 16 years and over: Total
- EMP_MALE
Employed civilian population 16 years and over: Male
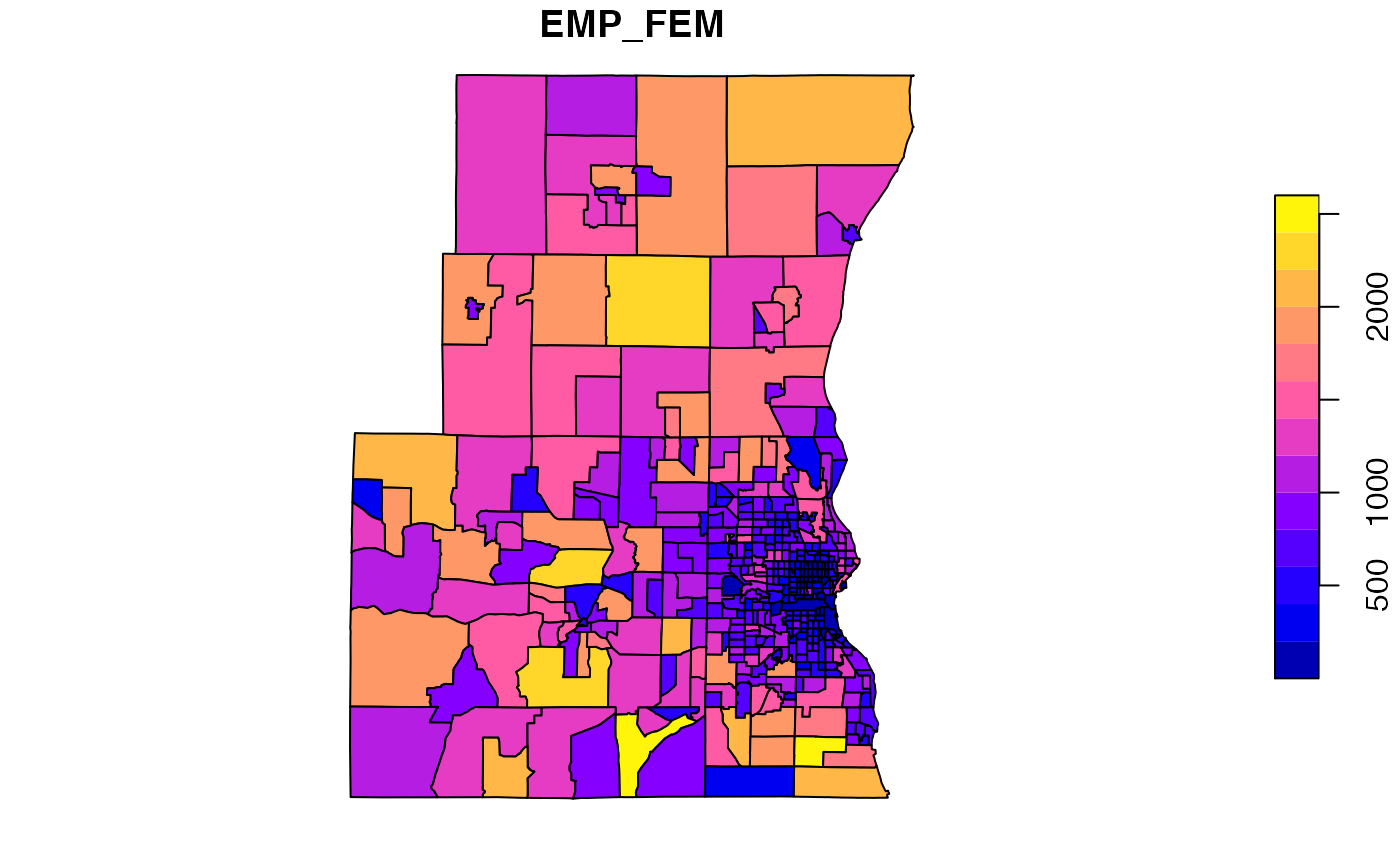
- EMP_FEM
Employed civilian population 16 years and over: Female
- OCC_MAN
Employed civilian population 16 years and over: Production occupations
- OCC_OFF1
Employed civilian population 16 years and over: Office (001-219 except 020, 021)
- OCC_INFO
Employed civilian population 16 years and over: Computer and mathematical occupations
- HH_INC
Households: Median household income in 1999
- POV_POP
Population for whom poverty status is determined: Total Population
- POV_TOT
Population for whom poverty status is determined: Income in 1999 below poverty level
- HSG_VAL
Owner-occupied housing units: Median value
- PCTBLCK
Percentage of black population
- POLYID
Unique ID
Source
2000 Census, Summary File 3. Available at http://factfinder.census.gov
Details
Sf object, unprojected. EPSG 4326: WGS84.
Examples
if (requireNamespace("sf", quietly = TRUE)) {
  library(sf)
  data(milwaukee1)

  plot(milwaukee1["EMP_FEM"])
}
