Homicides and selected socio-economic characteristics for counties surrounding Houston, TX. Data aggregated for three time periods: 1979-84 (steady decline in homicides), 1984-88 (stable period), and 1988-93 (steady increase in homicides).
houstonhom
Format
An sf data frame with 52 rows, 23 variables, and a geometry column:
- NAME
County name
- STATE_NAME
State name
- STATE_FIPS
State FIPS code (character)
- CNTY_FIPS
County FIPS code (character)
- FIPS
Combined state and county FIPS code (character)
- STFIPS
State FIPS code (number)
- COFIPS
County FIPS code (number)
- FIPSNO
Combined state and county FIPS code (number)
- HR8187
Homicide rate per 100,000 (1981-87)
- HR8791
Homicide rate per 100,000 (1987-91)
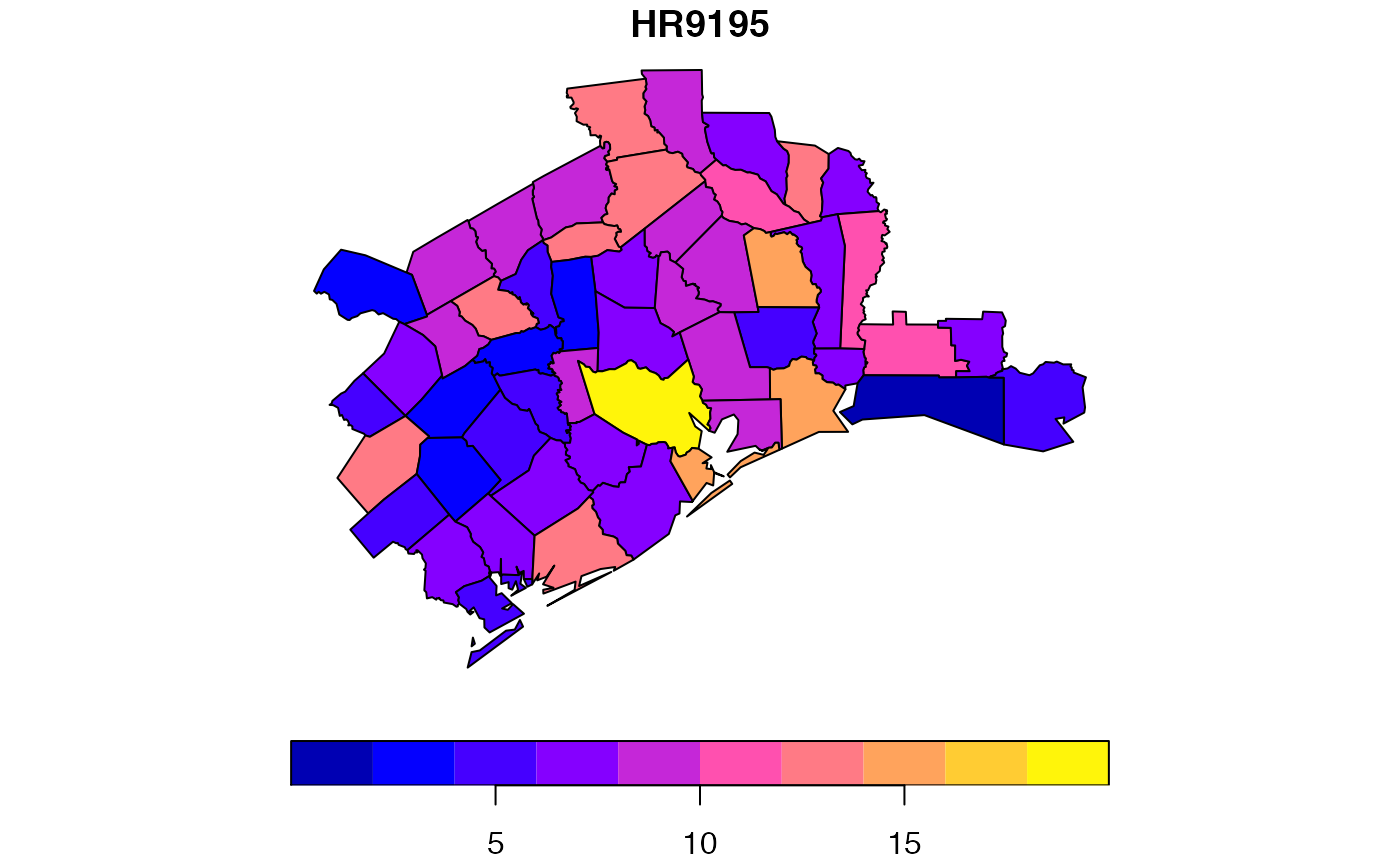
- HR9195
Homicide rate per 100,000 (1991-95)
- HC8187
Homicide count (1981-87)
- HC8791
Homicide count (1987-91)
- HC9195
Homicide count (1991-95)
- PO8187
Population total (1981-87)
- PO8791
Population total (1987-91)
- PO9195
Population total (1991-95)
- PE77
Police expenditures per capita, 1977
- PE82
Police expenditures per capita, 1982
- PE87
Police expenditures per capita, 1987
- RDAC80
Resource deprivation/affluence composite variable, 1980
- RDAC85
Resource deprivation/affluence composite variable, 1985
- RDAC90
Resource deprivation/affluence composite variable, 1990
Source
S. Messner, L. Anselin, D. Hawkins, G. Deane, S. Tolnay, R. Baller (2000). An Atlas of the Spatial Patterning of County-Level Homicide, 1960-1990. Pittsburgh, PA, www.ncovr.heinz.cmu.edu
Details
Sf object, unprojected. EPSG 4326: WGS84.
Examples
if (requireNamespace("sf", quietly = TRUE)) {
  library(sf)
  data(houstonhom)

  plot(houstonhom["HR9195"])
}