Income, race, and public health statistics for US counties.
healthplus
Format
An sf data frame with 3984 rows, 64 variables, and a geometry column:
- cartodb_id
Carto ID
- countyfp
County FIPS ID
- statefp
State FIPS code
- statename
State name
- countyname
County name and State
- countyfips
County FIPS code
- ratio
The county’s median income divided by the state’s median income
- cty_pop200
County’s population in 2000
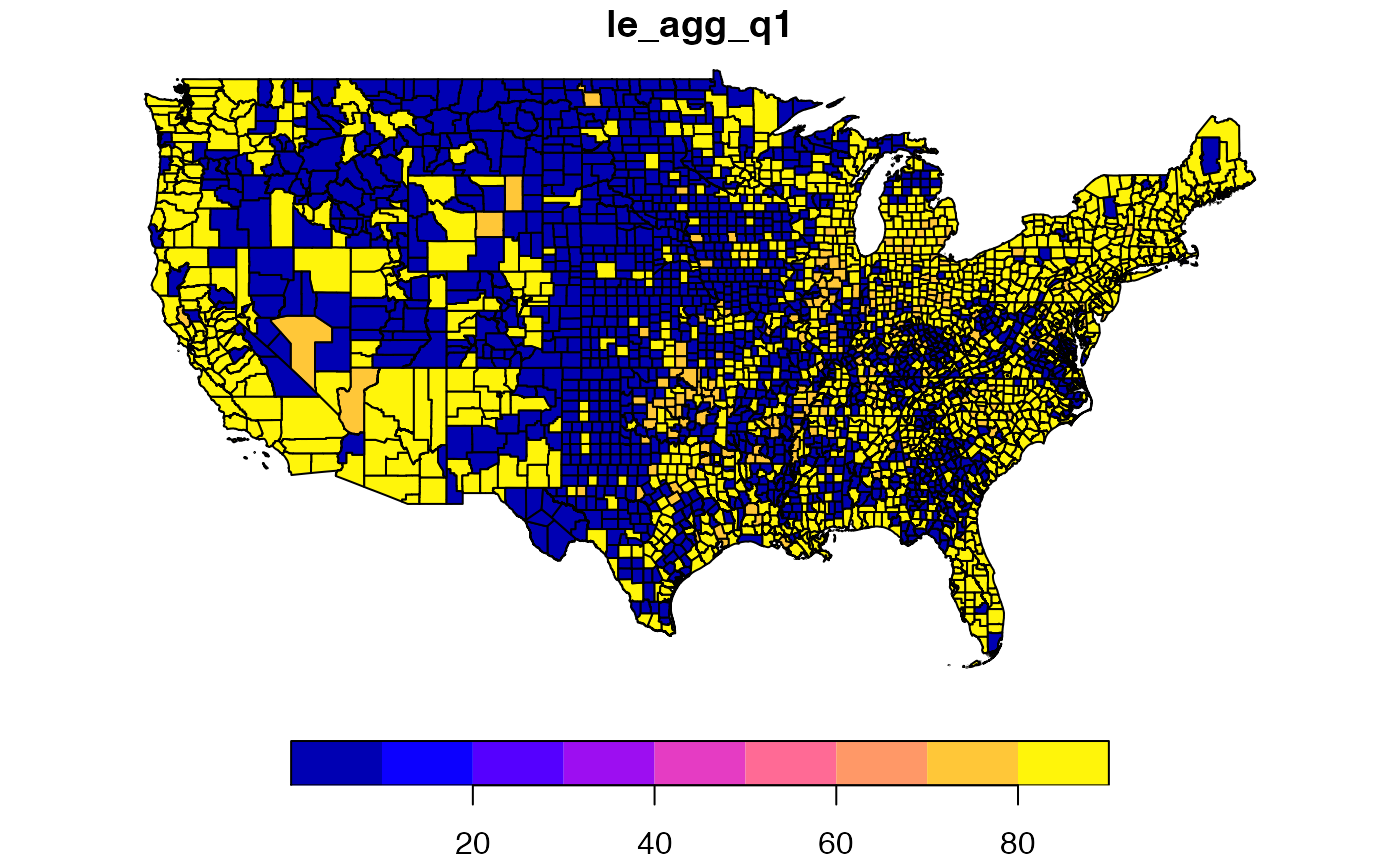
- le_agg_q1
Female life expectancy, 1st Income Quartile, not adjusted for race.
- le_raceadj
Female life expectancy, 1st Income Quartile, adjusted for race.
- le_agg_q2
Female life expectancy, 2nd Income Quartile, not adjusted for race
- le_racea_1
Female life expectancy, 2nd Income Quartile, adjusted for race
- le_agg_q3
Female life expectancy, 3rd Income Quartile, not adjusted for race
- le_racea_2
Female life expectancy, 3rd Income Quartile, adjusted for race
- le_agg_q4
Female life expectancy, 4th Income Quartile, not adjusted for race
- le_racea_3
Female life expectancy, 4th Income Quartile, adjusted for race
- le_agg_q11
Male life expectancy, 1st Income Quartile, not adjusted for race
- le_racea_4
Male life expectancy, 1st Income Quartile, adjusted for race
- le_agg_q21
Male life expectancy, 2nd Income Quartile, not adjusted for race
- le_racea_5
Male life expectancy, 2nd Income Quartile, adjusted for race
- le_agg_q31
Male life expectancy, 3rd Income Quartile, not adjusted for race
- le_racea_6
Male life expectancy, 3rd Income Quartile, adjusted for race
- le_agg_q41
Male life expectancy, 4th Income Quartile, not adjusted for race
- le_racea_7
Male life expectancy, 4th Income Quartile, adjusted for race
- sd_le_agg
Standard error for female life expectancy, 1st income Quartile, not adjusted for race.
- sd_le_race
Standard error for female life expectancy, 1st income Quartile, adjusted for race.
- sd_le_agg1
Standard error for female life expectancy, 2nd income Quartile, not adjusted for race.
- sd_le_ra_1
Standard error for female life expectancy, 2nd income Quartile, adjusted for race.
- sd_le_ag_1
Standard error for female life expectancy, 3rd income Quartile, not adjusted for race.
- sd_le_ra_2
Standard error for female life expectancy, 3rd income Quartile, adjusted for race.
- sd_le_ag_2
Standard error for female life expectancy, 4th income Quartile, not adjusted for race.
- sd_le_ra_3
Standard error for female life expectancy, 4th income Quartile, adjusted for race.
- sd_le_ag_3
Standard error for male life expectancy, 1st income Quartile, not adjusted for race.
- sd_le_ra_4
Standard error for male life expectancy, 1st income Quartile, adjusted for race.
- sd_le_ag_4
Standard error for male life expectancy, 2nd income Quartile, not adjusted for race.
- sd_le_ra_5
Standard error for male life expectancy, 2nd income Quartile, adjusted for race.
- sd_le_ag_5
Standard error for male life expectancy, 3rd income Quartile, not adjusted for race.
- sd_le_ra_6
Standard error for male life expectancy, 3rd income Quartile, adjusted for race.
- sd_le_ag_6
Standard error for male life expectancy, 4th income Quartile, not adjusted for race.
- sd_le_ra_7
Standard error for male life expectancy, 4th income Quartile, adjusted for race.
- count_q1_F
Female count, 1st income quartile.
- count_q2_F
Female count, 2nd income quartile.
- count_q3_F
Female count, 3rd income quartile.
- count_q4_F
Female count, 4th income quartile.
- count_q1_M
Male count, 1st income quartile.
- count_q2_M
Male count, 2nd income quartile.
- count_q3_M
Male count, 3rd income quartile.
- count_q4_M
Male count, 4th income quartile.
- Diversity
Diversity Index
- Asianalon
Asian alone, percent
- NativeHaw
Native Hawaiian, percent
- TwoorMor
Two or more races, percent
- Hispanico
Hispanic, percent
- Whitealon
White alone, percent
Source
Multiple sources: (1) ratio from https://philpierdo2.carto.com/me, (2) race and diversity index source: https://www.kaggle.com/mikejohnsonjr/us-counties-diversity-index and (3) income and life expectancy variables obtained from: Chetty, Stepner, Abraham, Lin, Scuderi, Turner, Bergeron, and Cutler (2016). The Association Between Income and Life Expectancy in the United States, 2001-2014. Health Statistics by County.
Details
Sf object, unprojected. EPSG 4326: WGS84.
Examples
if (requireNamespace("sf", quietly = TRUE)) {
  library(sf)
  data(healthplus)

  plot(healthplus["le_agg_q1"])
}