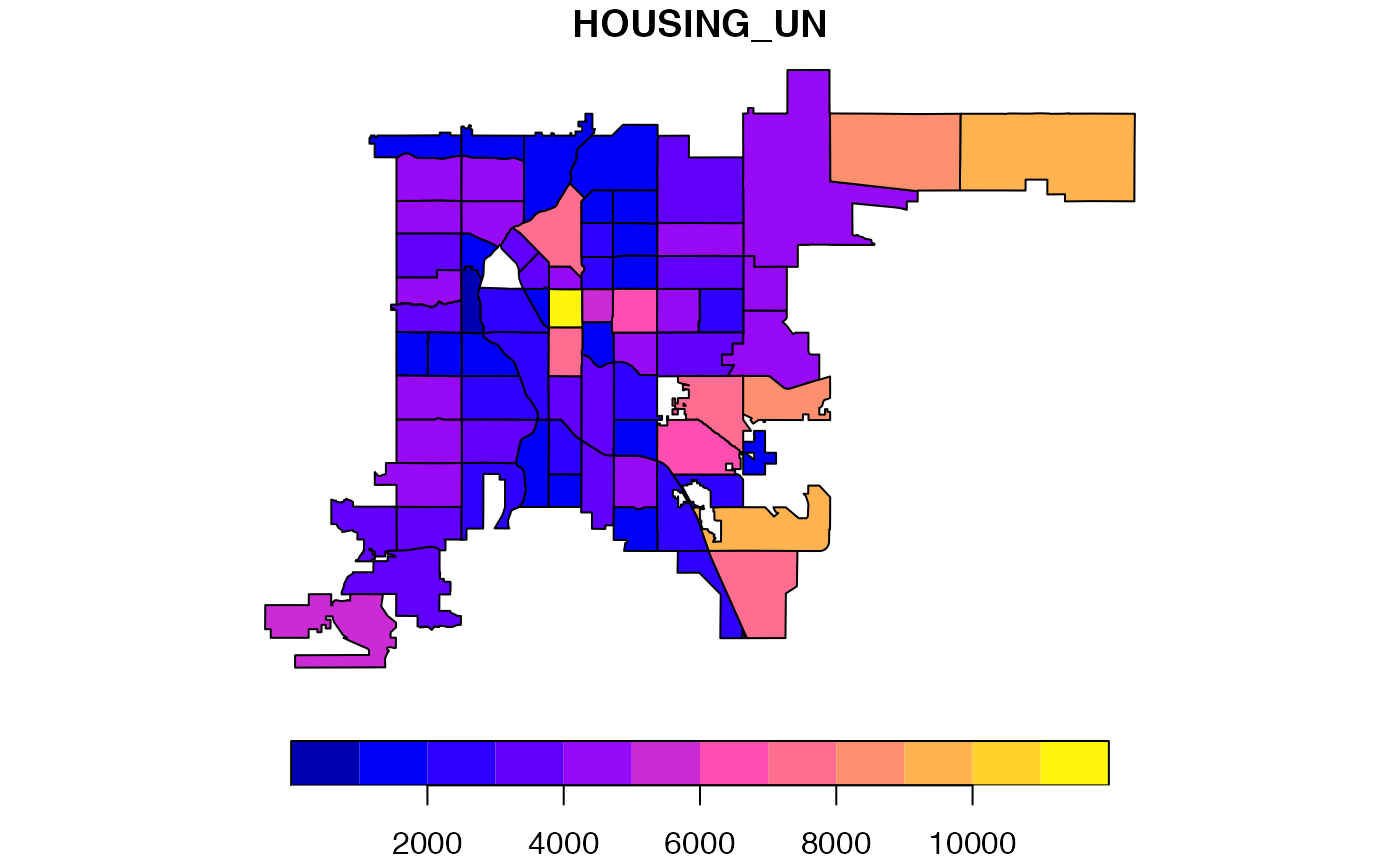
Demographics and housing characteristics of Denver neighborhoods (2010).
denver
Format
An sf data frame with 75 rows, 55 variables, and a geometry column:
- NBRHD_ID
Neighborhood ID
- NBRHD_NAME
Neighborhood name
- POPULATION
Population in 2010
- HISPANIC_2010
Hispanic population in 2010
- WHITE_2010
White population in 2010
- BLACK_2010
Black population in 2010
- NATIVEAM_2010
Native American population in 2010
- ASIAN_2010
Asian population in 2010
- HAWPACIS_2010
Hawaiian Pacific population in 2010
- OTHER_2010
Other race population in 2010
- TWO_OR_MOR
Population two or more races in 2010
- PCT_HISPAN
Hispanic as percentage of total population
- PCT_WHITE
White as percentage of total population
- PCT_BLACK
Black as percentage of total population
- PCT_AMERIN
American Indian as percentage of total population
- PCT_ASIAN
Asian as percentage of total population
- PCT_HAW_PA
Hawaiian Pacific as percentage of total population
- PCT_OTHER
Other race as percentage of total population
- PCT_TWO_OR
Two or more races as percentage of total population
- MALE
Male Population
- FEMALE
Female Population
- AGEX_Y
Population by age group. From X to Y
- PCT_LESS_1
Percentage of population under 1 year of age
- PCT_65_PLUS
Percentage of population over 65 years of age
- NUM_HOUSEH
Number of households
- ONE_PERSON
Number of households with one member
- TWO_PLUS
Number of households with more than two members
- FAMILY_HHL
Number of family households
- HUSB_WIFE
Number of households with husband/wife head type
- OTHER_FAMI
Number of households non-husband/wife head type
- MALE_SINGLE
Number of households male-single head type
- FEMAL_SING
Number of households female-single head type
- NON_FAMILY
Family households by household head type
- POP_QUAR
Population in group quarters
- GQ_INSTITU
Residents of group quarters: institutional (correctional, nursing, etc.)
- GQ_NONINST
Residents of group quarters: and non-institutional (military, college, etc.)
- HOUSING_UN
Number of housing units
- OCCUPIED_H
Number of occupied housing units
- VACANT_HU
Number of vacant housing units
- HU_OWNED
Number of owner-occupied housing units
- HU_RENTED
Number of renter-occupied housing units
Source
Details
Sf object, unprojected. EPSG 4326: WGS84.
