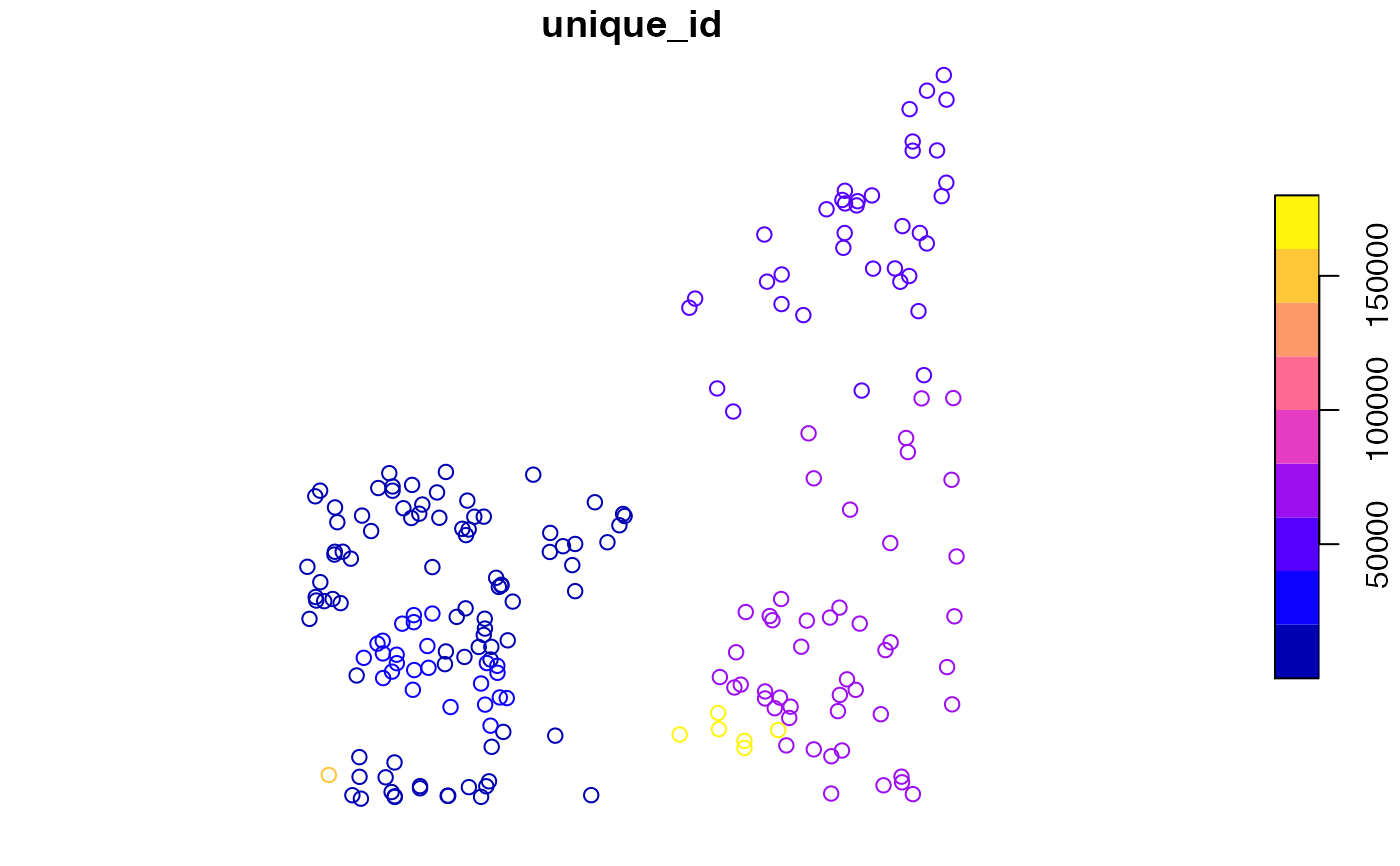
Location and sales price of home sales in a core area of Cleveland, OH for the fourth quarter of 2015.
cleveland
Format
An sf data frame with 205 rows, 9 variables, and a geometry column:
- unique_id
unique parcel id
- parcel
unique parcel number
- x
point latitude
- y
point longitude
- sale_price
price paid for the house ($)
- tract10int
License plate number and sometimes a description (state, color). Some entries did not include a plate number.
- quarter
quarter of sale (4th for all)
- year1
year of sale (2015 for all)
- yrquarter
year and quarter of sale (4th quarter of 2015 for all)
- geometry
POINT
Source
Cuyahoga County Fiscal Office. https://geodacenter.github.io/data-and-lab//clev_sls_154_core/
Details
Sf object, units in ft. EPSG 3734: NAD83 / Ohio North (ftUS).
Examples
if (requireNamespace("sf", quietly = TRUE)) {
  library(sf)
  data(cleveland)

  plot(cleveland["unique_id"])
}