Public health and socio-economic indicators for the 77 community areas of Chicago, IL, 2014.
chisociohealth
Format
An sf data frame with 77 rows, 86 variables, and a geometry column:
- ComAreaID
Community Area ID
- community
Community Area Name
- TRACTnt
Tract
- shape_area
polygon area
- shape_len
polygon perimeter
- Pop2012
Population in 2012
- Pop2014
Population in 2014
- PopChng
Population change
- PopM
Male Population in 2014
- PopF
Female population in 2014
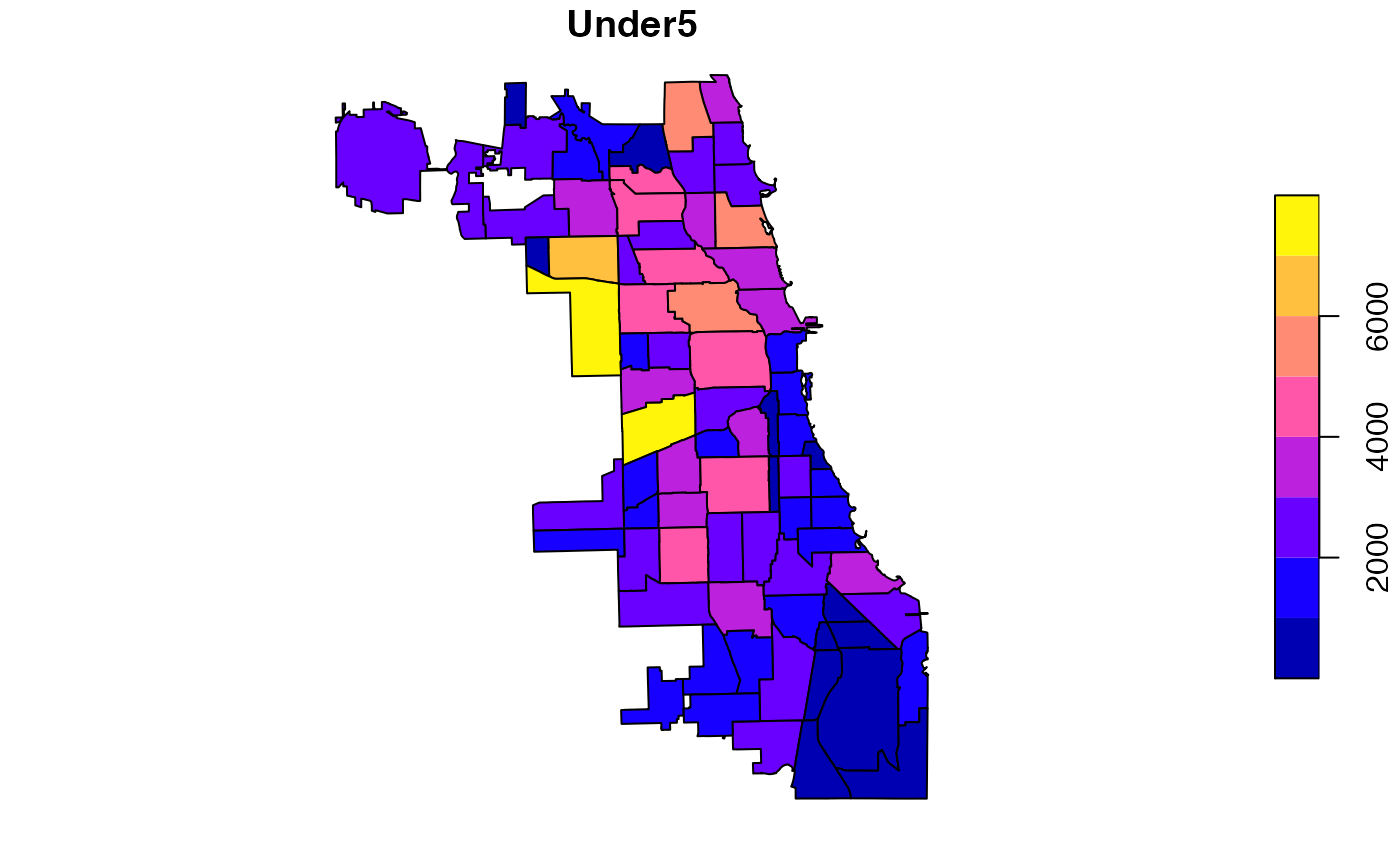
- Under5
Population age 0-5 in 2014
- Under18
Population age 0-18 in 2014
- Over21
Population over age 21 in 2014
- Over65
Population over age 65 in 2014
- Wht14
White population in 2014
- Blk14
Black population in 2014
- AI14
American Indian population in 2014
- AS14
Asian population in 2014
- NHP14
Native Hawaiian population in 2014
- Oth14
Population of other races in 2014
- Hisp14
Hispanic population in 2014
- PopMP
Proportion of male in the overall population in 2014
- PopFP
Proportion of female in the overall population in 2014
- Under5P
Proportion of under 5 in the overall population in 2014
- Under18P
Proportion of under 18 in the overall population in 2014
- Over18P
Proportion of over 18 in the overall population in 2014
- Over21P
Proportion of over 21 in the overall population in 2014
- Over65P
Proportion of over 65 in the overall population in 2014
- Wht14P
Proportion of white population in 2014
- Blk14P
Proportion of black population in 2014
- AI14P
Proportion of American Indian population in 2014
- AS14P
Proportion of asian population in 2014
- NHP14P
Proportion of native hawaiian population in 2014
- Oth14P
Proportion of other races population in 2014
- Hisp14P
Proportion of hispanic population in 2014
- Property_C
Number of property crimes
- PropCrRt
Property crime rate in 2014
- Violent_C
Number of violent crimes
- VlntCrRt
Violent crime rate in 2014
- PerCInc14
Per Capita Income
- PPop14
2014 Population base for 2014 poverty counts
- Pov14
Number of people living in poverty in 2014
- ChildPov14
Number of children (age 0-18) living in poverty in 2014
- NoHS14
Number of adults without a high school diploma in 2014
- HSGrad14
Number of high school graduates in 2014
- SmClg14
Number of people who have some college education in 2014
- ClgGrad14
Number of people who have a college degree in 2014
- LaborFrc
Number of people in the labor force in 2014
- Unemp14
Number of people unemployed in 2014
- Pov50
Number of people with income below 50pct of the poverty line
- Pov50P
Proportion of people with income below 50pct of the poverty line
- Pov125
Number of people with income below 125pct of the poverty line
- Pov125P
Proportion of people with income below 125pct of the poverty line
- Pov150
Number of people with income below 150pct of the poverty line
- Pov150P
Proportion of people with income below 150pct of the poverty line
- Pov185
Number of people with income below 185pct of the poverty line
- Pov185P
Proportion of people with income below 185pct of the poverty line
- Pov200
Number of people with income below 200pct of the poverty line
- Pov200P
Number of people with income below 200pct of the poverty line
- SESave
Average SES
- COIave
Average Childhood Opportunity Index
- HISave
Average Economic Hardship Index
- Hlitave
Average health literacy
- Birthrate
Birth rate per 1000 residents
- FertRate
Fertility rate per 1000 females aged 15-44
- LowBirthR
Percent of live births with low birth weight
- PrenScrn
Percent of females delivering a live birth, in which prenatal care began in first trimester
- PretBrth
Preterm births as percent of live births
- TeenBirth
Teen birth rate per 1000 females aged 15-19
- Assault
Homicide deaths per 100,000 persons (age adjusted)
- BrstCancr
Breast cancer deaths per 100,000 females (age adjusted)
- CancerAll
Cancer deaths per 100,000 persons (age adjusted)
- Colorect
Colorectal cancer deaths per 100,000 persons (age adjusted)
- DiabetM
Diabetes-related deaths per 100,000 persons (age adjusted)
- FirearmM
Firearm-related deaths per 100,000 persons (age adjusted)
- InfntMR
Infant mortality rate: deaths per 1000 live births
- LungCancer
Lung cancer deaths per 100,000 persons (age adjusted)
- ProstateC
Prostate cancer deaths per 100,000 males (age adjusted)
- Stroke
Stroke deaths per 100,000 persons (age adjusted)
- ChlBLLS
Childhood blood lead level screening, per 1000 children aged 0-6 years
- ChlLeadP
Childhood lead poisoning per 100
- GonorrF
Gonorrhea in females, per 10,000 females age 15-44
- GonorrM
Gonorrhea in males, per 10,000 females age 15-44
- Tuberc
Tuberculosis per 100,000 persons
Source
Economic Hardship Index method based on the Intercity Hardship Index, by Richard P. Nathan and Charles F. Adams, Jr. in Understanding Urban Hardship, Political Science Quarterly 91 (Spring 1976): 47-62.). Main source: https://data.cityofchicago.org/Health-Human-Services/Public-Health-Statistics-Selected-public-health-in/iqnk-2tcu
Details
Sf object, unprojected. EPSG 4326: WGS84.
Examples
if (requireNamespace("sf", quietly = TRUE)) {
  library(sf)
  data(chisociohealth)

  plot(chisociohealth["Under5"])
 }