1998 and 2001 Zip Code Business Patterns (Census Bureau) for Charleston, SC MSA.
charleston2
Format
An sf data frame with 42 rows, 59 variables, and a geometry column:
- ZIP
ZIP code
- PO_NAME
Name of ZIP code area
- STATE
State abbreviation
- POP2001
Population 2001
- MSA
Metropolitan Statistical Area
- EMP98
Total mid-march employees, 1998
- EST98
Total establishments in ZIP code, 1998
- EFLAG98
A if PAY98 missing
- PAY98
Total annual payroll ($1,000), 1998
- EST01
Total establishments in ZIP code, 2001
- EMP01
Total mid-march employees, 2001
- EFLAG01
A if PAY01 missing
- CBSA_CODE
Core-based statistical area code
- MAN98
1998 total manufacturing establishments (MSA)
- MAN98_12
1998 total manufacturing establishments, 1-9 employees (MSA)
- MAN98_39
1998 total manufacturing establishments 10+ employees (MSA)
- MAN01
2001 total manufacturing establishments (MSA)
- MAN01_12
2001 total manufacturing establishments, 1-9 employees (MSA)
- MAN01_39
2001 total manufacturing establishments, 10+ employees (MSA)
- MAN98US
1998 total manufacturing establishments (US)
- MAN98US12
1998 total manufacturing establishments, 1-9 employees (US)
- MAN98US39
1998 total manufacturing establishments 10+ employees (US)
- MAN01US
2001 total manufacturing establishments (US)
- MAN01US_12
2001 total manufacturing establishments, 1-9 employees (US)
- MAN01US_39
2001 total manufacturing establishments, 10+ employees (US)
- OFF98
1998 total office establishments (MSA)
- OFF98_12
1998 total office establishments, 1-9 employees (MSA)
- OFF98_39
1998 total office establishments, 10+ employees (MSA)
- OFF01
2001 total office establishments (MSA)
- OFF01_12
2001 total office establishments, 1-9 employees (MSA)
- OFF01_39
2001 total office establishments, 10+ employees (MSA)
- OFF98US
1998 total office establishments (US)
- OFF98US12
1998 total office establishments, 1-9 employees (US)
- OFF98US39
1998 total office establishments, 10+ employees (US)
- OFF01US
2001 total office establishments (US)
- OFFUS01_12
2001 total office establishments, 1-9 employees (US)
- OFFUS01_39
2001 total office establishments, 10+ employees (US)
- INFO98
1998 total information establishments (MSA)
- INFO98_12
1998 total information establishments, 1-9 employees (MSA)
- INFO98_39
1998 total information establishments, 10+ employees (MSA)
- INFO01
2001 total information establishments (MSA)
- INFO01_12
2001 total information establishments, 1-9 employees (MSA)
- INFO01_39
2001 total information establishments, 10+ employees (MSA)
- INFO98US
1998 total information establishments (US)
- INFO98US12
1998 total information establishments, 1-9 employees (US)
- INFO98US39
1998 total information establishments, 10+ employees (US)
- INFO01US
2001 total information establishments (US)
- INFO01US_1
2001 total information establishments, 1-9 employees (US)
- INFO01US_3
2001 total information establishments, 10+ employees (US)
- INDEX
Index
- NUMSEC
Number of sectors represented in ZIP code
- PCTNGE
National growth effect, percent (N)
- PCTIME
Industry mix effect, percent (M)
- PCTCSE
Competitive shift effect, percent (S)
- PCTGRO
Percent growth establishments, 1998-2001 (R)
- ID
Unique ZIP code ID for ID variables in weights matrix creation window
Source
1998 and 2001 Zip Code Business Patterns, US Census Bureau.
Details
Sf object, unprojected. EPSG 4326: WGS84.
Examples
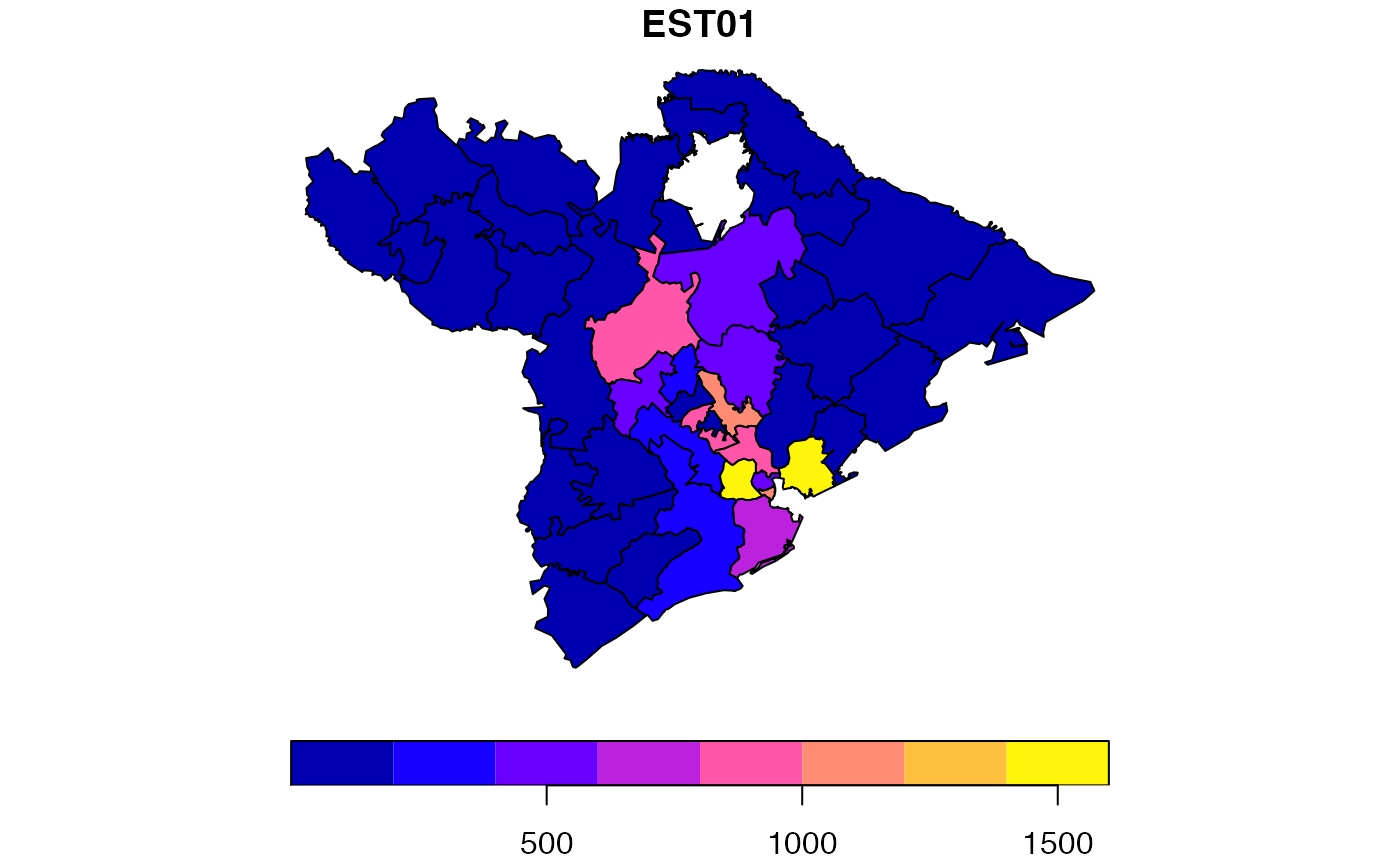
if (requireNamespace("sf", quietly = TRUE)) {
  library(sf)
  data(charleston2)

  plot(charleston2["EST01"])
}