Sudden Infant Death Syndrome sample data for North Carolina counties, two time periods (1974-78 and 1979-84). Same as SIDS data set, except that the computed rates are included.
SIDS
Format
An sf data frame with 100 rows, 17 variables, and a geometry column:
- AREA
County area (computed by ArcView)
- PERIMETER
County perimeter (computed by ArcView)
- CNTY_ID
County internal ID
- NAME
County name
- FIPS
County fips code, as character (state code and county code)
- FIPSNO
County fips code, numeric, used in GeoDa User’s Guide and tutorials
- CRESS_ID
County ID used by Cressie (1993)
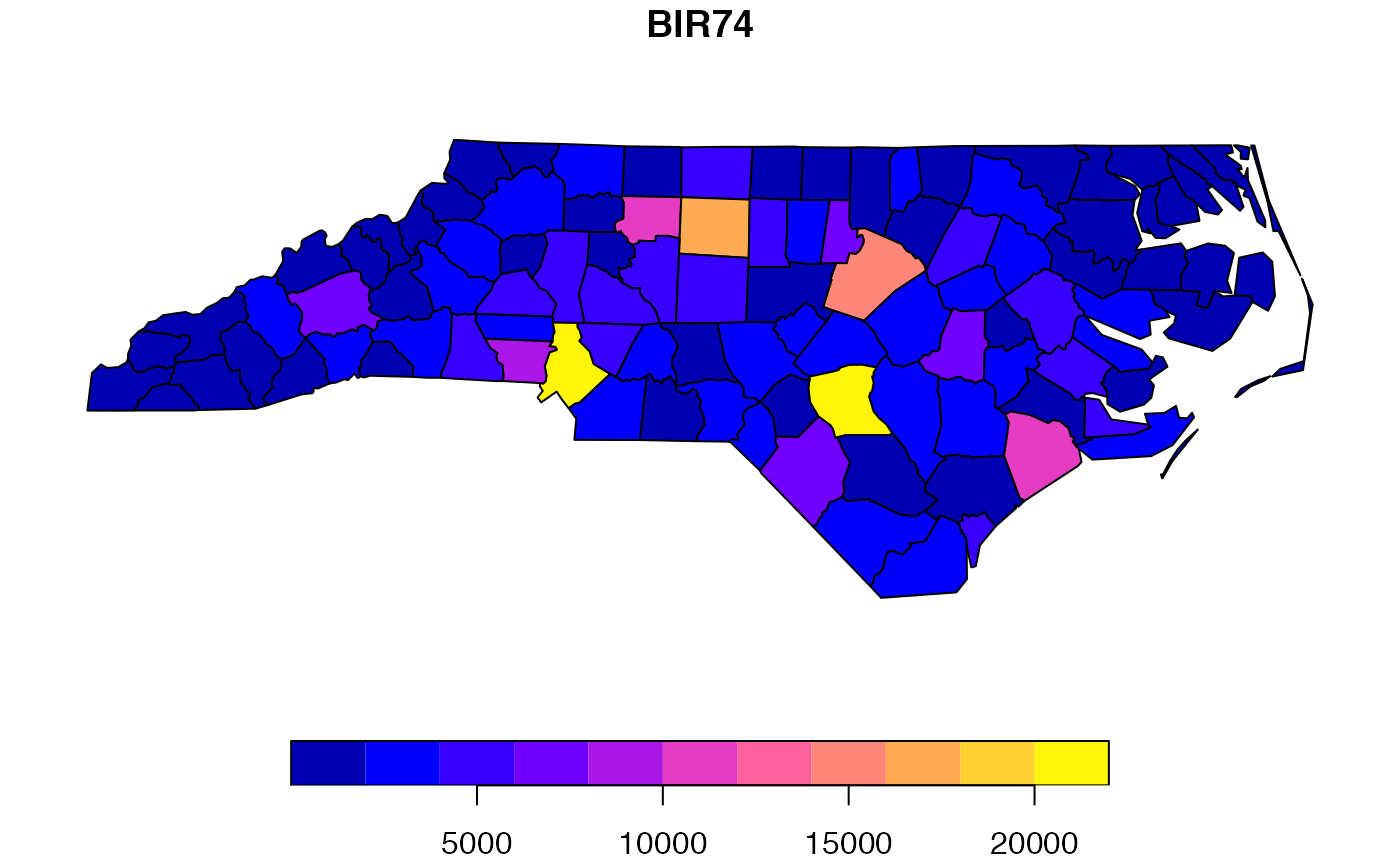
- BIR74
Live births, 1974-78
- SID74
SIDS deaths, 1974-78
- NWBIR74
Non-white births, 1974-78
- BIR79
Live births, 1979-84
- SID79
SIDS deaths, 1979-84
- NWBIR79
Non-white births, 1979-84
- SIDR74
SIDS death rate per 1,000 (1974-78)
- SIDR79
SIDS death rate per 1,000 (1979-84)
- NWR74
Non-white birth rate (non-white per 1000 births), 1974-78
- NWR79
Non-white birth rate (non-white per 1000 births), 1979-84
Source
Cressie, N. (1993). Statistics for Spatial Data. New York, Wiley, pp. 386-389. Rates computed.
Details
Sf object, unprojected. EPSG 4326: WGS84.