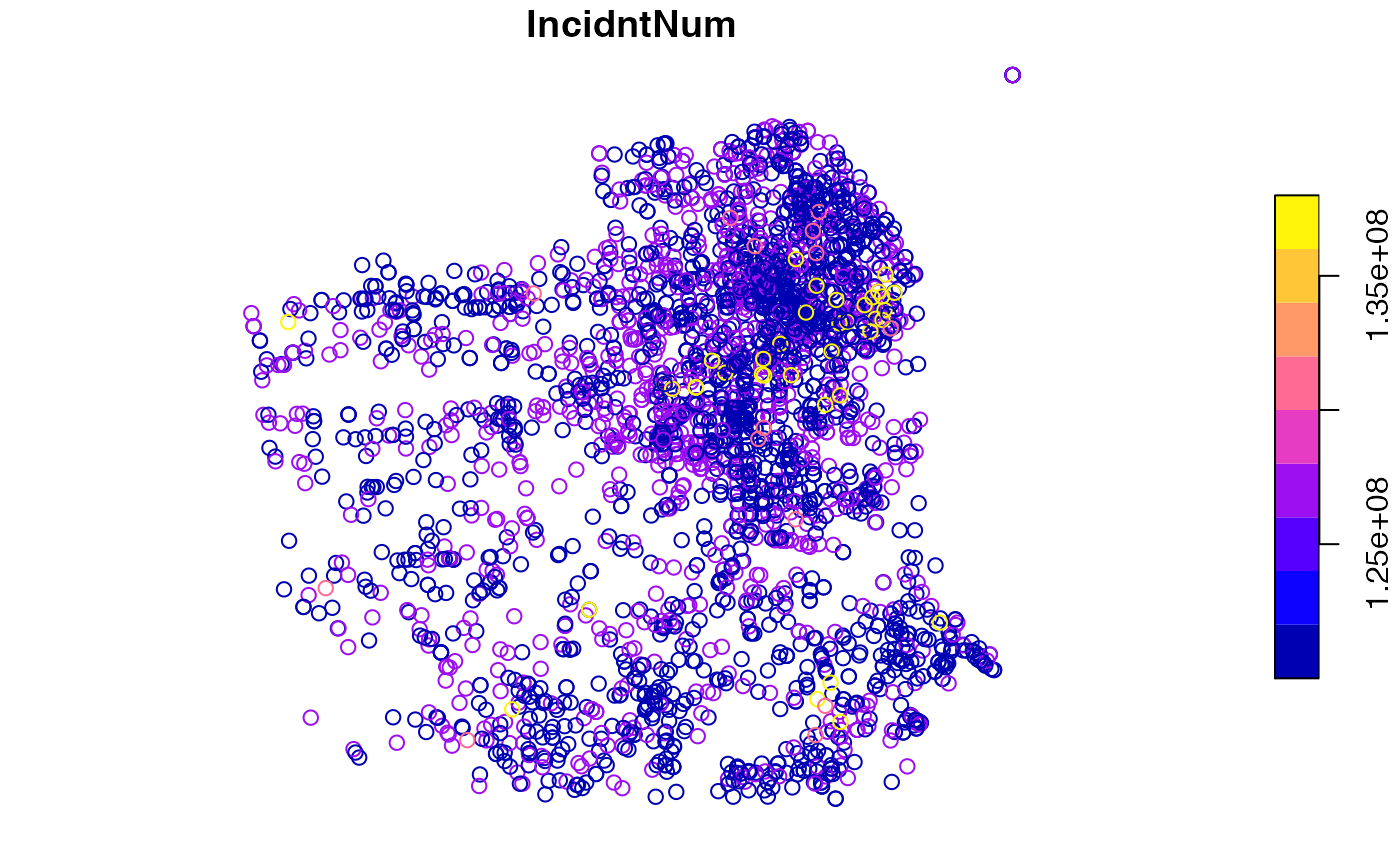
Incidents of vandalism for July 1 to December 31, 2012.
SFvandalism
Format
sf data frame with 3430 observations, 14 variables, and a geometry column.
- IncidntNum, IncidntN_1
Unique number for each incident report
- X_pr, Y_pr
projected coordinates
- Category
Vehicle theft
- Descript
Description of the crime
- DayOfWeek
day of the week that crime was reported
- PdDistrict
Police district
- Resolution
Outcome of the report, e.g. None, Arrest, Unfounded etc
- Location
Street address where the crime occurred
- Date
Date of the report
- Time
Time of report
- X, Y
Coordinates of crime location
Source
2010 Census (population) and “Crime Incidents from 1 Jan 2003”, City of San Francisco Open Data Portal (crimes) (https://data.sfgov.org/Public-Safety/Map-Crime-Incidents-from-1-Jan-2003/gxxq-x39z).
Details
Sf object, EPSG 2227: NAD83 / California zone 3 (ftUS).
Examples
if (requireNamespace("sf", quietly = TRUE)) {
  library(sf)
  data(SFvandalism)
  plot(SFvandalism["IncidntNum"])
}
